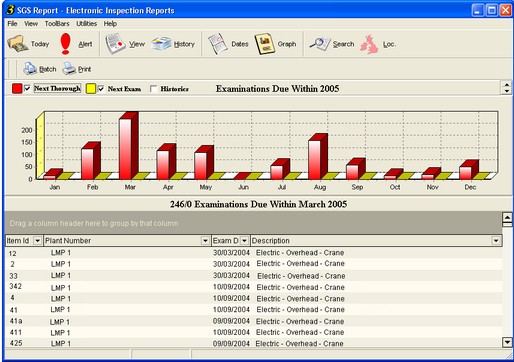
From information contained within previously issued reports, SGS Report produces graphs to show when the next inspection for a particular item of plant is due. To access the graphing option, click ![]() on the Tool Bar. The graph screen will open, showing a graph of "Next Thorough" and "Next Exam" due within the current year and a report listing of "Next Thorough" and "Next Exam" due within the current month:
on the Tool Bar. The graph screen will open, showing a graph of "Next Thorough" and "Next Exam" due within the current year and a report listing of "Next Thorough" and "Next Exam" due within the current month: