The default options on the Graph screen may be altered to amend the information graphed and displayed:
Inspection Type and Superseded Reports
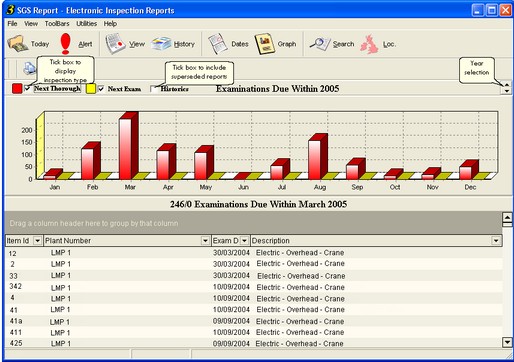
The "Next Thorough", "Next Exam" and "Historics" tick boxes may be ticked/unticked to alter the information presented by the graph. The "Next Thorough" and "Next Exam" tick boxes control which type of inspection to display, whilst the Historics box controls whether superseded reports are displayed. As the selection is amended, the Graph screen will automatically update to reflect the changes.
Time frame displayed
By default, the current year and month are displayed when Graph is first selected. To amend the year, click the Year selection arrows to increase or decrease the year as required. To change the reports displayed in the Report Listing area, click on one of the month bars of the graph to show the reports for that month.
Report Listing
For information on working with the Report Listing, please see Working with Report Lists.